Occupational Therapy Assistant Salary
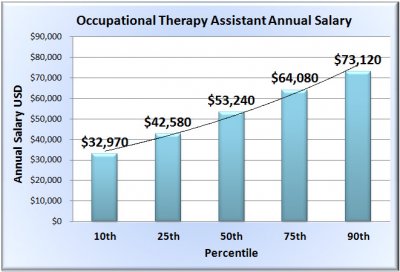
 For occupational therapy assistants in the United States, the average salary is $53,090, while the mean hourly wage is $25.52. When looking at the top and bottom 10 percent of earners for this occupation, the annual salary level ranges from about $73,120 to $32,970. Some of the top paying employers for occupational therapy assistants include home healthcare services, nursing care facilities, health practitioner officers and specialty hospitals. Pay also varies by location, with the highest average salaries found in the city areas of Las Vegas-Paradise, NV ($73,930), Fort Worth-Arlington, TX ($76,360), and Reading, PA ($72, 390). Bonuses may be paid to occupational therapy assistants by their employers, and can reach up to $973 per year.
Employment Rate
In the United States, about 29,500 people work as occupational therapy assistants in 2012. Most are employed in health practitioner offices, nursing care facilities and hospitals. There are also occupational therapy assistants who work in schools or deliver home healthcare services.
Job Outlook
The employment rate for this occupation expected to rise from 2012 to 2022 by 43 percent, with an estimated 12,900 new job openings in the next decade.
Occupational Therapy Assistant Salary by State
| State | Lowest 10% | Median Salary | Highest 10% | Average Salary | |
| Alabama | $40,620 | $54,600 | $71,540 | $54,430 | |
| Alaska | NA | NA | NA | NA | |
| Arizona | $20,510 | $28,390 | $67,670 | $37,630 | |
| Arkansas | $29,170 | $51,100 | $71,990 | $50,840 | |
| California | $48,790 | $67,440 | $86,730 | $65,920 | |
| Colorado | $23,160 | $43,490 | $61,420 | $42,750 | |
| Connecticut | $40,840 | $56,040 | $72,070 | $55,730 | |
| Delaware | $41,580 | $60,440 | $87,010 | $62,170 | |
| Florida | $41,180 | $59,210 | $74,100 | $58,330 | |
| Georgia | $40,990 | $56,360 | $71,680 | $55,510 | |
| Hawaii | $39,320 | $45,050 | $56,170 | $45,680 | |
| Idaho | $38,640 | $55,800 | $75,200 | $55,390 | |
| Illinois | $31,220 | $52,550 | $72,320 | $51,940 | |
| Indiana | $36,640 | $53,100 | $69,570 | $52,540 | |
| Iowa | $38,760 | $50,870 | $61,950 | $50,280 | |
| Kansas | $32,690 | $56,640 | $75,520 | $55,710 | |
| Kentucky | $35,820 | $54,030 | $71,860 | $53,760 | |
| Louisiana | $37,040 | $55,050 | $72,600 | $54,110 | |
| Maine | $36,280 | $45,760 | $59,040 | $46,570 | |
| Maryland | $38,390 | $59,360 | $74,660 | $58,070 | |
| Massachusetts | $37,470 | $53,360 | $69,920 | $52,740 | |
| Michigan | $30,560 | $42,810 | $58,370 | $43,750 | |
| Minnesota | $22,500 | $41,300 | $55,500 | $39,620 | |
| Mississippi | $33,210 | $47,050 | $70,120 | $49,170 | |
| Missouri | $39,500 | $54,470 | $71,130 | $54,460 | |
| Montana | $24,530 | $39,160 | $56,420 | $39,400 | |
| Nebraska | $38,990 | $54,540 | $75,410 | $55,570 | |
| Nevada | $48,780 | $65,630 | $153,060 | $76,420 | |
| New Hampshire | $33,170 | $50,980 | $67,280 | $50,080 | |
| New Jersey | $45,100 | $64,380 | $76,240 | $62,310 | |
| New Mexico | $25,350 | $32,140 | $63,310 | $39,640 | |
| New York | $32,590 | $48,210 | $68,910 | $48,910 | |
| North Carolina | $34,060 | $55,180 | $72,010 | $53,480 | |
| North Dakota | $31,200 | $42,410 | $57,960 | $43,030 | |
| Ohio | $38,910 | $53,420 | $71,770 | $53,540 | |
| Oklahoma | $17,690 | $49,060 | $69,570 | $45,340 | |
| Oregon | $43,110 | $55,130 | $70,220 | $55,020 | |
| Pennsylvania | $31,410 | $44,080 | $61,350 | $45,680 | |
| Rhode Island | $39,610 | $48,080 | $66,710 | $50,240 | |
| South Carolina | $19,580 | $49,120 | $69,700 | $47,140 | |
| South Dakota | $30,000 | $35,700 | $44,900 | $36,140 | |
| Tennessee | $34,280 | $52,560 | $70,240 | $51,720 | |
| Texas | $30,400 | $63,740 | $88,320 | $62,050 | |
| Utah | $41,000 | $53,640 | $69,420 | $54,000 | |
| Vermont | NA | NA | NA | NA | |
| Virginia | $36,070 | $62,000 | $80,740 | $59,590 | |
| Washington | $42,890 | $56,510 | $73,840 | $57,280 | |
| West Virginia | $40,790 | $53,470 | $70,070 | $53,830 | |
| Wisconsin | $34,000 | $46,520 | $59,020 | $46,730 | |
| Wyoming | $34,730 | $45,230 | $59,780 | $46,410 |
